Microstructures
by George Langford, Sc.D., Massachusetts Institute of Technology, Cambridge, MA, 1966
Copyright©2015 by George Langford
Low Alloy Steels - Lesson 1 - Thought Experiment
See Answer at the Bottom of This Page
Metastable Iron-Carbon Phase Diagram
Discussion and Preparatory Explanation
http://www.georgesbasement.com/Microstructures/LowAlloySteels/Lesson-1/Slide05.jpg In the early 1970's I was doing an experiment at Monsanto's Research Park Development Center with the casting of steel wire directly from the melt using their technology, which was based on the addition of small amounts of silicon to the liquid steel and on the selective reaction of that silicon with carbon monoxide to form a silica envelope around the liquid stream to stabilize it against breakup into droplets by surface-tension effects.

I was trying to speed up the solidification process in an effort to avoid shrinkage porosity, which was the bugaboo of Monsanto's wire-casting efforts. I added forced cooling with helium using a helical pattern of gas jets directed crosswise to the liquid stream. The stream could be seen to follow a wavy pattern, but it would tolerate pretty high velocities of the helium without getting disrupted.

As the helium flow rate was increased, the recalescence point in the stream rose higher and higher until it reached a critical point, then suddenly dropped down significantly, and became both extremely steady (not diffuse as before that point) and quite pronounced, from below red heat to white hot.

The resulting wire was mostly light tan in color, but had occasional lengths of a blue color.
The tan color was due to oxidation of the still-hot wire by exposure to air below the cooling chamber, but the blue color was a surprise. We later found out that the blue portion of the wire was martensitic and was blue because of the extra heat of transformation from austenite to martensite. There had been no austenite in the tan wire, which we found to be a mixture of ferrite and iron carbide by metallographic examination.

Our addition of extra cooling had caused the liquid iron - ca. 0.4 percent carbon liquid to freeze directly to body-centered cubic iron, skipping the face-centered cubic austenite region of the iron-carbon phase diagram. The liquid steel was supercooled so much that it went almost instantly to solid ferrite, as inferred from the sharpness of the transition from barely red hot liquid to white hot solid ferrite, the liquid/solid interface traveling up the stream as fast as the liquid was flowing downstream. The blue sections of the wire were the result of occasional formation of grain boundaries in the ferrite at which austenite grains could then grow and later transform to martensite.

Armed with this history, make a new iron carbon phase diagram (in the region below one precent carbon) without the austenite phase. Bear in mind that delta ferrite and alpha iron both have the same body-centered cubic crystal structure. They are isomorphous.

It is helpful to make use of schematic free-energy composition curves in your thought process.

Here's the Answer to the Problem of the Missed Austenite Region

Meta-Metastable Fe-Cementite phase diagram The extreme left-hand portion of the iron-carbon phase diagram appears as shown at left when expanded sufficiently to show the details of the delta iron-liquid iron region.

Under meta-metastable conditions when the gamma phase (i.e., austenite) fails to form, the delta ferrite-liquid iron phase boundary extends downwards with temperature and to the right with carbon content, and the alpha iron - cementite (i.e. Cm) phase boundary extends upwards with temperature and to the right with carbon content. The two extrapolations meet at a new metastable eutectic temperature where the remaining liquid iron solidifies to alpha iron plus cementite. This meta-metastable eutectic temperature is lower than the metastable eutectic where liquid iron solidifies to gamma iron plus cementite.

In my actual experience, this ferrite plus liquid --> ferrite  plus cementite microconsituent was just a random distribution of cementite blobs in a ferrite matrix.

But here's the key question: Why did the solidifying stream recalesce to white heat when the projected meta-metastable eutectic should have been in the cherry red range ?
Remember: The original liquid composition was only 0.4 percent carbon.
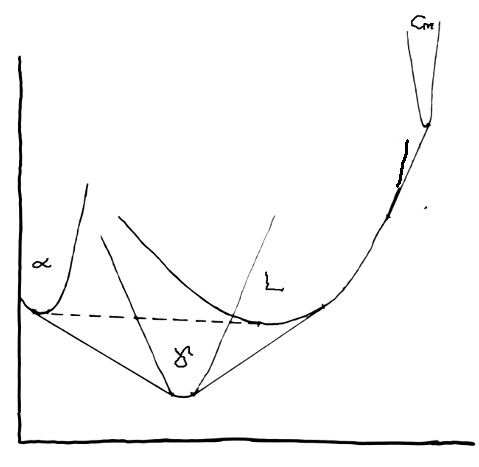
Free Energy Curves for Fe-Cementite phase diagram
The schematic free energy-composition curves at left are drawn for a temperature higher than the two eutectic temperatures of the meta-metastable iron-carbon phase diagram above. In the experiment described in the introduction the liquid stream undercooled sufficiently that the ensuing solidification occured by the meta-metastable eutectic wherein liquid iron went directly to alpha iron plus cementite.

Note how that the tangent points define the composition limits of each phase and their positions in the phase diagram. This sketch is not meant to be quantitative !

Theoretically, you can reconstruct the free-energy curves for each phase by plotting the positions of the intersections of a series horizontal lines drawn through the phase diagram at the temperatures of interest with the various phase boundaries.

It is very important to realize that removing the free-energy curve for the gamma phase does not affect the other three free-energy curves, but that does affect the tangent points for the two-phase regions in unavoidable ways.