This casting was inoculated with a small amount of sodium just before pouring the liquid metal into the mold. Sodium suppresses the nucleation of the silicon particles and changes their morphology.
|
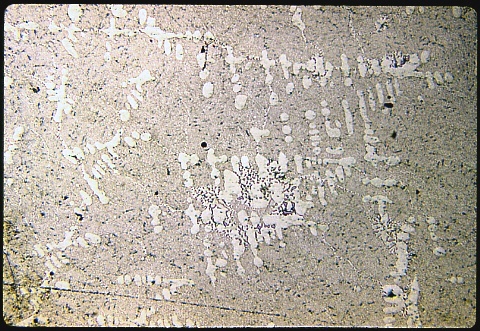
This aluminum - 13% silicon alloy has been modified in order to avoid the poor
microstructure of the preceding specimen. The photomicrograph at
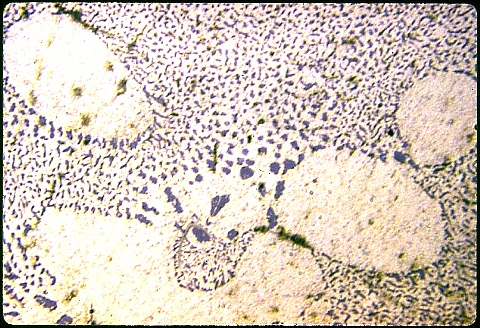
left was made at 50X magnification to show the overall microstructure,
whereas the one below was made at 500X to show the shape and
distribution of the silicon particles. The etchant is HF as
before. This casting was inoculated with a small amount of sodium just before pouring the liquid metal into the mold. Sodium suppresses the nucleation of the silicon particles and changes their morphology. |
|
The primary phase is now alpha aluminum, lying in a sea of
eutectic microconstituent having a much superior morphology: islands of
well dispersed silicon in an alpha matrix. |
 The
aluminum - silicon phase diagram shown at left has been annotated
to explain the change in solidification path caused by the
sodium inoculation. The
aluminum - silicon phase diagram shown at left has been annotated
to explain the change in solidification path caused by the
sodium inoculation. Nucleation of silicon is suppressed by the sodium, so primary alpha forms when the metastable liquid supercools below the equilibrium liquidus temperature of alpha. It does so according to the metastable extension of the alpha liquidus below the equilibrium eutectic temperature. The liquid becomes enriched in silicon because silicon is rejected from the newly forming solid alpha, so the remaining liquid becomes even more hypereutectic. However, the only difference between the primary and eutectic silicon that forms in the remaining liquid is that the primary silicon is coarser than the eutectic silicon. Hence, the amount of silicon in what appears to be all eutectic microconstituent surrounding the primary alpha remains consistent with an hypereutectic overall composition, even though a nontrivial amount of primary alpha is present. This is an excellent example of the use of an equilibrium phase diagram to understand metastable phase relationships. The microstructure that you see is by no means guaranteed to be consistent with its composition according to the phase diagram. You must also know the detailed processing history of the specimen. Specimen 4 is another alloy. |